top of page


Copper
Zinc
Silver
Nickel
Manganese
Iron
Gold
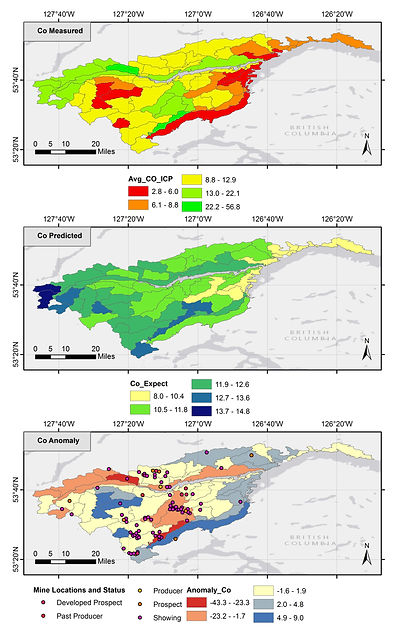
Cobalt
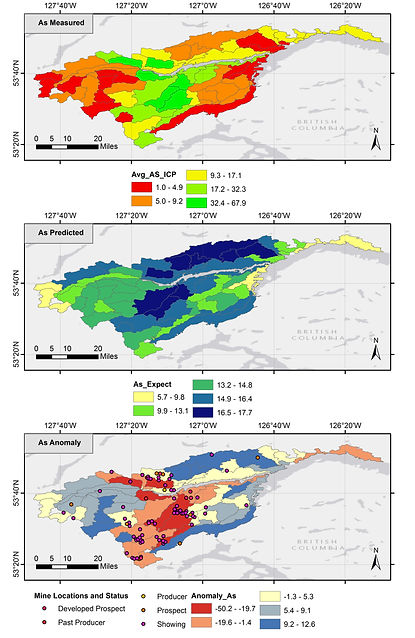
Arsenic

For each element, we have included a map of the average concentration for all sediment data points that were measured within each catchment basin. The second map is our calculated expected concentration within each watershed. And the third map displays the deviation from the measured and expected values with high anomalous concentrations showing up in red.
bottom of page